- Published on
ASEAN energy trends – reflecting after five months in the region
- Authors
-
-

- Name
- Vivienne Roberts
- in/viviroberts
-
So far on my travels I have been to Singapore, Malaysia, the Philippines, Vietnam and I am now in Thailand. I thought it might be a good time to stop and reflect on some of the energy trends in the countries that I have visited, and to give some thought to what I may find in Thailand. All of these countries form part of the ASEAN group – the Association of South Eastern Asian Nations.
The IEA, in their energy outlook report for 2013 for the ASEAN group, put the following graph together. I can tell you that from my experiences in these countries, I’d tend to agree with their findings. The first thing I noticed upon arriving in Bangkok, after spending over two months in Vietnam after two months in the Philippines, was that there is definitely more money in Thailand. Singapore is on such a different scale that it should almost not be included in the graph. I suppose it could be the exception that proves the rule (or trend) in the region.
![ASEAN electricity demand per cap vs income [Source: IEA]](https://energyramblings.s3.us-west-2.amazonaws.com/img/2016/01/Thailand_per_cap_E_cons.png)
It’s interesting to look at these graphs and stats after travelling in the region for a while. Here’s another one showing how the wealthier countries have pretty much got universal access to electricity, and that those countries that are in the middle region are still fairly reliant on biomass consumption, even if they have access to electricity.

Many of the street food vendors in Vietnam (delicious by the way) were using charcoal under their carts to cook their food. So you see this in action even in the cities.
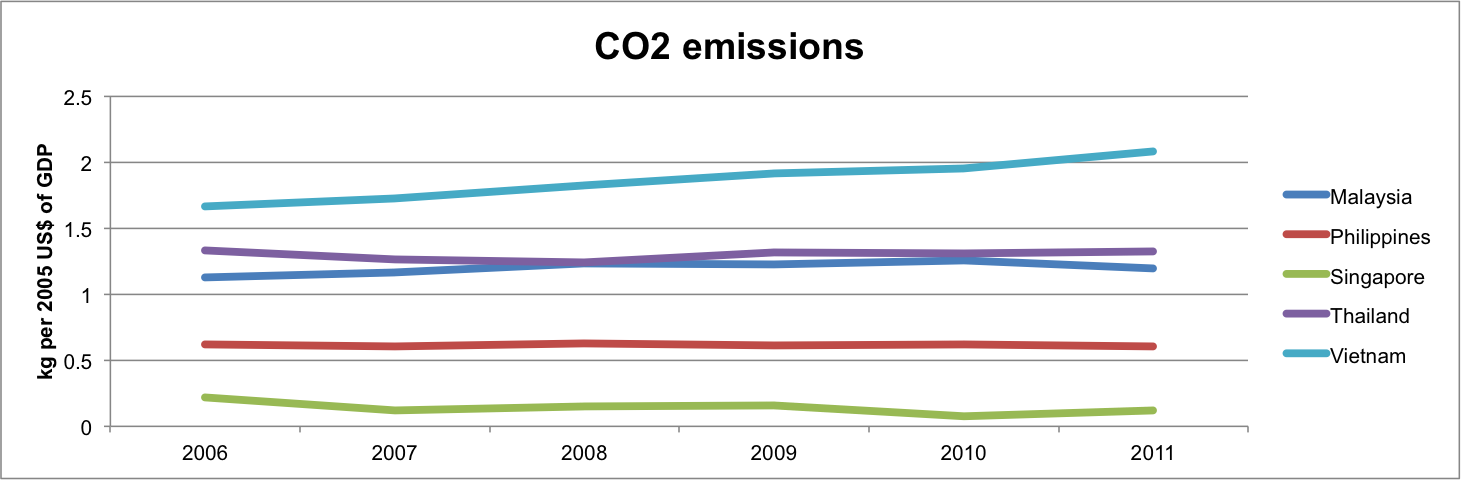
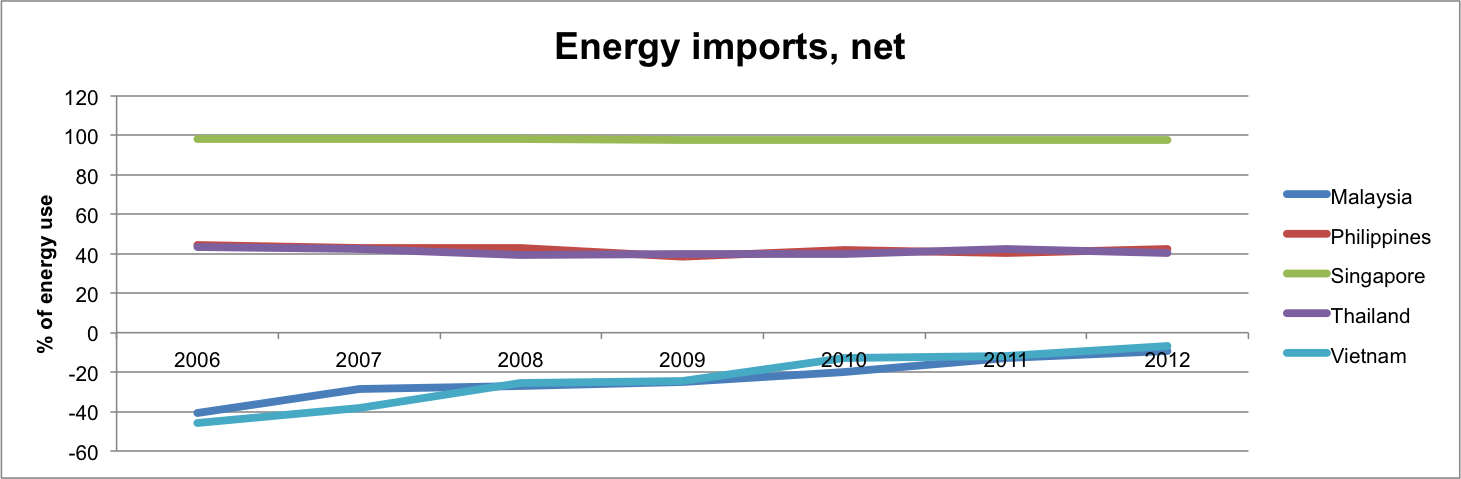
I have had a look at the info available on the World Bank’s Database, and have pulled out some graphics on some key energy related stats for the region. What they show is a general trend for increasing CO2 emissions, increasing energy consumption and a consistent or increasing reliance on energy imports. Renewables are increasing, slowly, for all countries other than the Philippines, where the noticeable drop in renewables is balanced by a sharp increase in coal consumption).