- Published on
Eskom tariff changes: a quick and dirty look at some impacts on the City of Cape Town
- Authors
-
-

- Name
- Vivienne Roberts
- in/viviroberts
-
Eskom tariff changes:
Eskom has recently had tariff increases approved by the energy regulator, NERSA. The average tariff increase approved for 2015/16 equates to 12.69%. This comes into effect from the 1st April for all non-municipal customers, and from the 1st July for the municipalities.
The individual tariffs that make up the whole Eskom tariff suite are not all changing by the same amount, however, and some are increasing more than others. For example, the Megaflex tariff for municipalities is increasing by 14%, whereas the Nightsave Rural Tariff, for instance, is increasing by around 12.7%. I haven’t looked through them all.
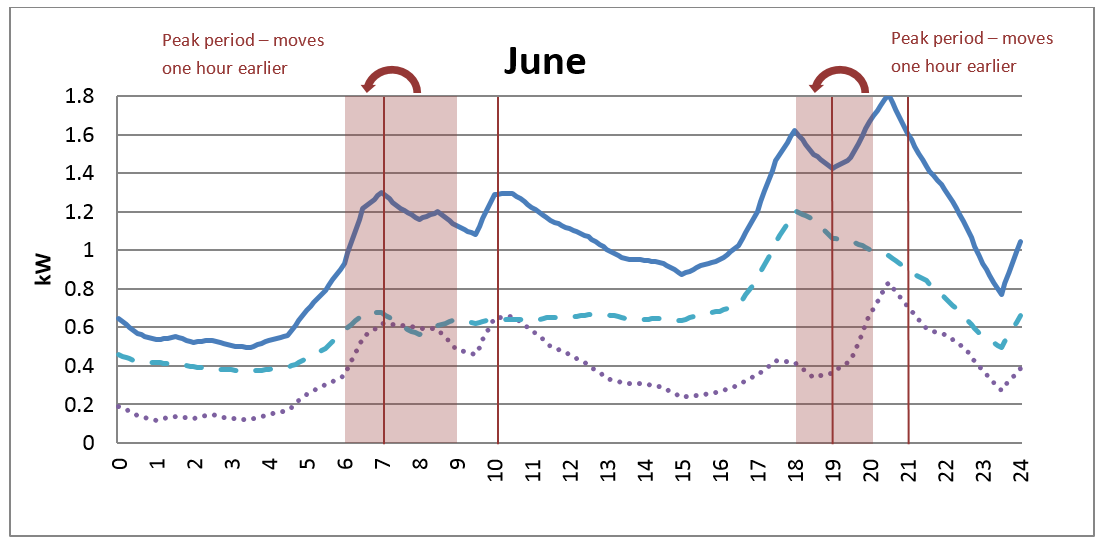
Another key change is that the morning and evening peak times that apply during winter months (June – August) are moving forward by one hour, to better align with national peak demand periods.
This is shown in the graph below 1

How does this impact the City of Cape Town?
Mark-up implications
The City purchases electricity from Eskom at wholesale prices, and resells it on to its customers, after applying a mark-up. The tariff mark-up is dependent on the allowable tariff structure, the fixed and variable costs associated with distributing electricity, the cross-subsidies inherent in the tariffs (for instance, to allow for free basic electricity to low-income households), as well as the extent to which NERSA allows for the sale of electricity to cross-subsidise the rates base (I believe this is around 10%). This means that the City will not automatically be increasing their tariffs by 14%, as this would mean increasing their mark-up by 14% also.
However, increasing tariffs inevitably result in consumers using electricity more sparingly, which means that passing through Eskom’s tariff increases without increasing the mark-up would result in less ‘profit’ on electricity, and therefore less money to cover fixed costs and cross-subsidies. This can result in the City needing to increase tariffs further to make-up for it. Enter the vicious circle syndrome.
Time of use implications
With a simple tariff structure like the Domestic tariff, electricity was sold in 2014 at R1.35/kWh or R1.64/kWh (ex VAT), but the City is purchasing electricity anywhere between around R0.30/kWh to R2.10/kWh, depending on the time of use.
Therefore, it benefits the City the most if residential consumers consume electricity in off-peak times in summer, as they’ll be making the most ‘profit’ off the sale. Electricity sold during peak times in winter, however, will actually cost the City money. This is a result of the tariff structure, as the City is not able to pass through the time-of-use concept in their residential tariffs.
The City would therefore want Eskom’s peak period to be misaligned with their maximum demand period for all non-time-of-use tariffs.
The graphs below show an average household demand curve in January and June 2. While these are not definitive and are based on 2010 data, they show that the change in the winter peak period could possibly benefit the City on the residential tariffs if winter peaks are sitting at around 8pm. They also show the impact that electric geysers have on this peak period, and how solar water heaters or demand side management of geyser loads could help to lop off/shift that peak period.


Sources:
1 – Eskom: “2015/16 changes to the winter time-of-use peak periods and tariff charge name changes”
2 – Trollip et al: “Potential impact on municipal revenue of small scale own generation and energy efficiency”